Pipeline lineage
Pipeline lineage shows you exactly where the data enters the pipeline, the transformations/queries it goes through within the pipeline, and where it ultimately exits (the destination data warehouse or table).
Pipeline lineage visually maps the journey of data within a specific pipeline. It illustrates the following:
- The data source(s) that the pipeline reads from.
- The specific tables and columns being extracted from those sources.
- The transformations or query logic applied to the data as it flows through the pipeline.
- The data warehouse(s) or table(s) where the processed data is written.
- The connection between the source and destination, which represents the pipeline itself.
- A detailed flow chart for a single data movement process that you have defined in DataGOL.
To access Pipeline Lineage:
- Navigate to the Lakehouse section in DataGOL and go to the Pipelines page.
- Select the specific pipeline for which you want to view the lineage. This will open the Summary page.
- In the Summary page, from the Source section on the right, click the gear icon.
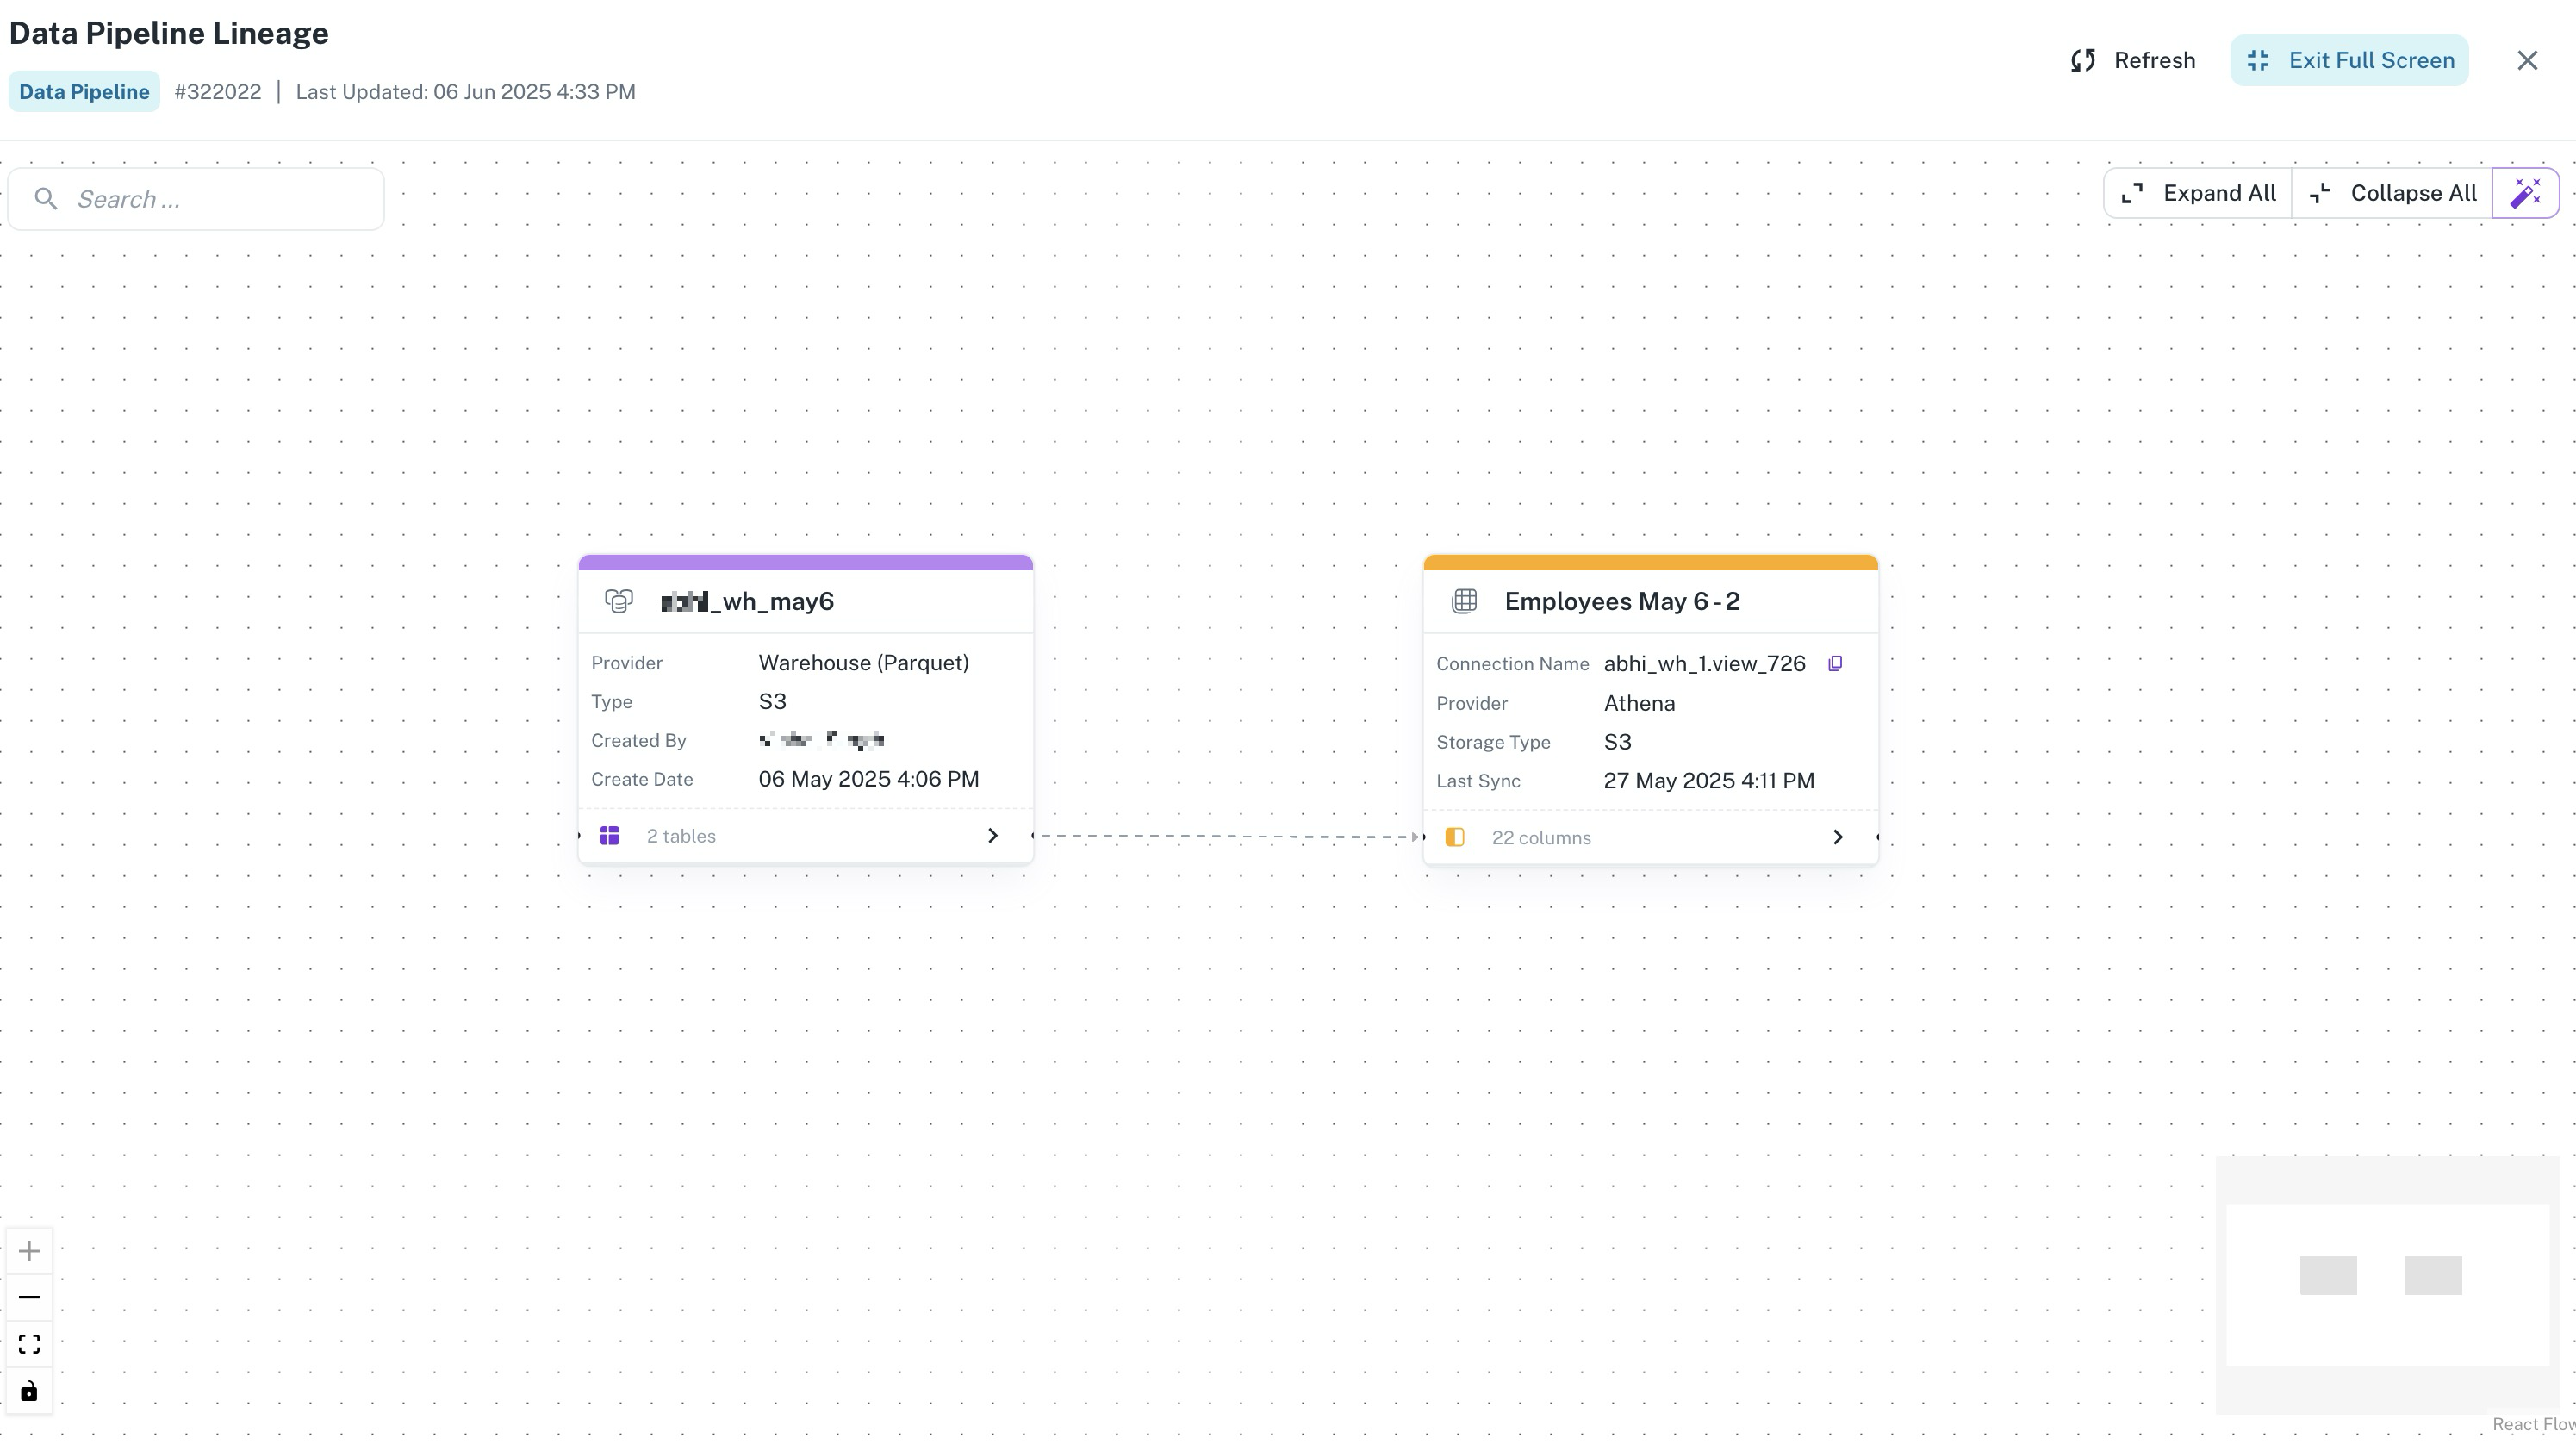
- From the drop-down menu, select View Lineage. A graphical representation will appear, showing the source data source, the tables and columns being used, the pipeline itself (highlighted on the edge connecting source and destination), and the destination warehouse with the resulting tables and columns.
- Click on an edge (the connection between nodes) to display metadata about the pipeline responsible for that data flow.
Was this helpful?